VISCOVER is now featured in the RStudio Shiny Gallery!
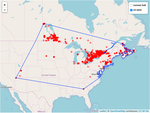
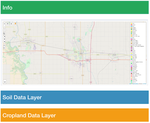
I am so happy to share the news that my R Shiny app viscover is now featured in the RStudio Shiny Gallery. 🎉 🎉 🎉 It's categorized into the Public Sector section in the Gallery due to its application to the soil survey data and cropland data layer maintained by the USDA. viscover takes its name from VIsulizing Soil and Crop data and their OVERlay. Although my motivation to develop
Fun blogdown in R to design a personal website
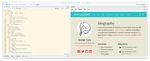
Inspired by David Robinson‘s keynote talk at the RStudio conference 2019 (summary in the following tweet), I decided to write a post about how I use Yihui‘s fantastic R package blogdown to develop my own personal website.
When you’ve written the same code 3 times, write a function
When you’ve given the same in-person advice 3 times, write a blog post
— David Robinson (@drob) November 9, 2017 Well, there are a lot of useful references to check out.
Fun Leaflet in R with NYC Squirrel Census Data
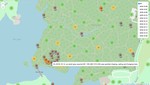
Anabelle introduced the NYC Squirrel Census data to me today. It also comes from the recommended dataset of #TidyTusday. Both of us adore squirrels 😍. The dataset contains variables which can tell when (Date) and where (longitude X and latitude Y) people saw a squirrel of certain age (Age) and fur color (Primary Fur Color) conducting some activities (Running, Climbing, Chasing, Eating, Foraging or Other Activities).
Having some experience working with leaflet in R, I find it very interesting to visualize this data set on an interactive map.
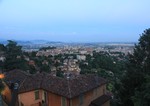
2019暑期游记
个人网站上的第一篇中文博客献给值得纪念的2019年暑假, 响应谢老大的号召,我网故我在。 一个人的七天欧洲之旅 因为参加一个国际会议,我短暂拜访了
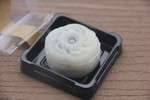
Showcase my home-made dessert
🍰 🍰 🍰
dessert
Gsoc 2018 test
Here is my solution to one of the 2018 google summer of code project tests. The source code and output are available at http://rpubs.com/lyux/gscoc2018_test.