Fun Leaflet in R with NYC Squirrel Census Data
Anabelle introduced the NYC Squirrel Census data to me today. It also comes from the recommended dataset of #TidyTusday. Both of us adore squirrels 😍. The dataset contains variables which can tell when (Date) and where (longitude X and latitude Y) people saw a squirrel of certain age (Age) and fur color (Primary Fur Color) conducting some activities (Running, Climbing, Chasing, Eating, Foraging or Other Activities).
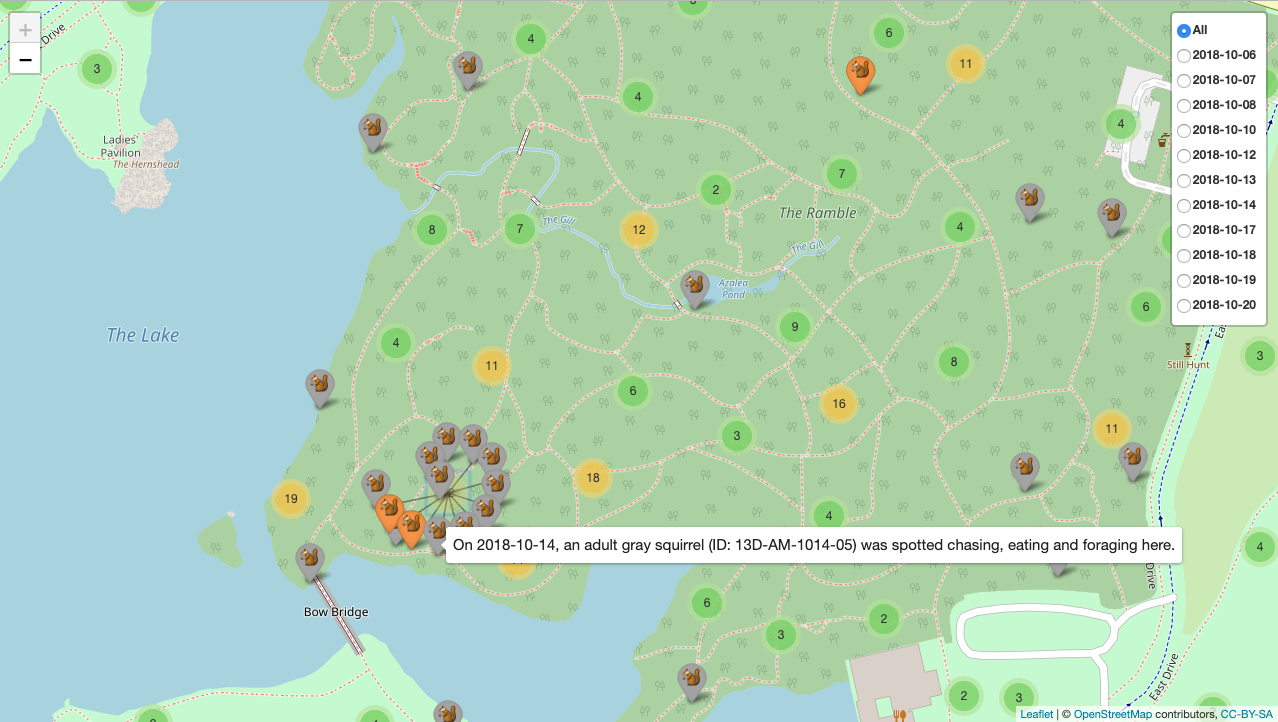
Having some experience working with leaflet in R, I find it very interesting to visualize this data set on an interactive map. I used clustered circle markers with a number label associated with the count of squirrels to make the data points more readable. The awesome map marker with a squirrel icon is made possible by referring to the Emoji Unicode. Once zoomming in, one can hover each map marker to see the tooltip which includes a summary about the reported squirrel spotted at that location on a particular day. The summary is a complete sentence that tells the ID, age, fur color and activity of the squirrel. The primary fur color of the squirrel is mapped to the marker color. Click on the above image to see and interact with the map to the full extent. The layer group control at the top right corner allows visualizing the squirrel data by day. Below is the corresponding R code.
library(dplyr)
library(leaflet)
sq <- readr::read_csv("../../static/data/2018_Central_Park_Squirrel_Census_-_Squirrel_Data.csv")
xc <- sq$`Primary Fur Color`
icons <- awesomeIcons(
text = "🐿",
markerColor = case_when(
xc == "Gray" ~ "lightgray",
xc == "Black" ~ "black",
xc == "Cinnamon" ~ "orange",
TRUE ~ "white"
))
act_sum <- sq %>% select(Running:Foraging) %>% mutate(ID = 1:n()) %>%
tidyr::gather(act_cat, indicator, -ID) %>%
filter(indicator == "true") %>% group_by(ID) %>%
summarise(activity = glue::glue_collapse(act_cat, sep = ", ", last = " and "))
sq <- sq %>% mutate(ID = 1:n()) %>% left_join(act_sum, by = "ID") %>%
mutate(Age = replace(Age, Age=="?", "")) %>%
tidyr::replace_na(replace = list(activity = "", Age = "",
`Primary Fur Color` = ""))
map <- sq %>% leaflet() %>% addTiles() %>%
addAwesomeMarkers(
lng = ~X, lat = ~Y, icon = icons,
clusterOptions = markerClusterOptions(),
label = ~sprintf("On %s, %s %s %s squirrel (ID: %s) was spotted %s here.",
lubridate::mdy(Date),
ifelse(Age=="Adult", "an", "a"), tolower(Age),
tolower(`Primary Fur Color`), `Unique Squirrel ID`,
tolower(activity)),
labelOptions = labelOptions(textsize = "15px"),
group = "All")
for(day in unique(sq$Date)){
map <- map %>%
addAwesomeMarkers(
lng = ~X, lat = ~Y, icon = icons,
clusterOptions = markerClusterOptions(),
label = ~sprintf("On %s, %s %s %s squirrel (ID: %s) was spotted %s here.",
lubridate::mdy(Date),
ifelse(Age=="Adult", "an", "a"), tolower(Age),
tolower(`Primary Fur Color`), `Unique Squirrel ID`,
tolower(activity)),
data = sq %>% filter(Date == day),
labelOptions = labelOptions(textsize = "15px"),
group = lubridate::mdy(day))
}
map %>% addLayersControl(
baseGroups = c("All", sort(as.character(lubridate::mdy(unique(sq$Date))))),
options = layersControlOptions(collapsed = FALSE))