Empirical Bayes small area prediction
under a zero-inflated lognormal model
with correlated random effects
Xiaodan Lyu
Joint work with Dr.Emily Berg
04 February 2020
Basic Setting
Predictions for small domains are our primary interest.
Standard survey estimators are often unreliable given small sample sizes. (Rao, Molina, 2015)
Use model to incorporate auxiliary information (known for the whole population).
Basic Setting
Predictions for small domains are our primary interest.
Standard survey estimators are often unreliable given small sample sizes. (Rao, Molina, 2015)
Use model to incorporate auxiliary information (known for the whole population).
Data motivation (CEAP RUSLE2)
skewed data with heavy zeros
potential correlation between the positive part and the binary part
area mean, quantiles around 15% zeros skewed income data, wine production
Data Model
Suppose response variable \({y}_{ij}^*, i=1,..,D;j=1,..,N_i\) satisfies $${y}_{ij}^*=y_{ij}\delta_{ij}$$
Positive part: $$\log(y_{ij})=\beta_0+\mathbf{z}'_{1,ij}\boldsymbol{\beta}_1+u_i+e_{ij}$$ where \(e_{ij} \overset{i.i.d}{\sim} N(0, \sigma^2_e)\).
Binary part: \(\text{Pr}(\delta_{ij}=1) = p_{ij}\), $$g(p_{ij})=\alpha_0+\mathbf{z}_{2,ij}'\boldsymbol\alpha_1+b_i$$ where \(g(\cdot)\) is the parametric link function to be specified.
Data Model
Lognormal extension
Mathematically tractable and computationally simple.
SAE lognormal model - Berg and Chandra (2013).
SAE zero-inflated lognormal - Lyu (2018).
Correlated random effects
$$\left(\begin{array}{c} u_{i} \\ b_{i}\end{array}\right) \stackrel{iid}{\sim} \mbox{BVN}(\boldsymbol{0}, \boldsymbol{\Sigma}_{ub}), \boldsymbol{\Sigma}_{ub} = \begin{pmatrix}\sigma_u^2 & \color{red}{\rho}\sigma_{u}\sigma_{b}\\\color{red}{\rho}\sigma_{u}\sigma_{b} & \sigma_b^2 \end{pmatrix}$$
"plug-in" approach of Chandra, Chambers (2016) => implicitly assume independence
Bayesian approach of Pfeffermann et al (2018) => requires specifying prior distributions
linear mixed model used for the positive part
Empirical Bayes general
The minimum mean squared error (MMSE) predictor of \(\color{blue}{\zeta_{i} = \frac{1}{N_i}\sum_{j=1}^{N_i}y_{ij}^*}\) is $$\hat\zeta_{i}^{\rm{MMSE}}=\frac{1}{N_i}\Big\{\sum_{j \in s_i} y_{ij}^* + \sum_{j \in \bar s_i}\hat{y}_{ij}^{*\rm{MMSE}}\Big\}$$ where \(\hat{y}_{ij}^{*\rm{MMSE}} = \color{blue}{E_{\theta}(y_{ij}^*|\boldsymbol{y}^*_{s_i})}\)
Let \(\hat{\boldsymbol \theta}\) be a consistent estimator of model parameter \(\boldsymbol \theta\). $$\hat \zeta_{i}^{\rm{EB}}=\frac{1}{N_i}\Big\{\sum_{j \in s_i} y_{ij}^* + \sum_{j \in \bar s_i} \hat y_{ij}^{*\rm{EB}} \Big\}$$ where \(\hat y_{ij}^{*\rm{EB}}=\hat{y}_{ij}^{*\rm{MMSE}}(\color{red}{\hat{\boldsymbol\theta}})\)
We replace the true \(\boldsymbol \theta\) with an estimator to obtain the EB predictor nonsampled units \(\bar s_i\)
Conditional Distribution
Result 1:
$$u_i|\color{red}{b_i}, \boldsymbol{y}^*_{s_i} \sim N(\tilde\mu_{u_i}, \tilde{\sigma}^2_{u_i})$$ where $$\tilde\mu_{u_i} = \gamma_i\bar{\tilde{r}}_i+(1-\gamma_i)\Big[\rho\frac{\sigma_u}{\sigma_b}{b_i}\Big], \tilde\sigma_{u_i}^2 = \gamma_i{\sigma_e^2}/{\tilde{n}_i}$$ and \(\color{blue}{\gamma_i = (1-\rho^2)\sigma_u^2 [(1-\rho^2)\sigma_u^2+\sigma_e^2/\tilde{n}_i]^{-1}}, \tilde{n}_i=\sum_{j\in s_i}\delta_{ij}\), $$\bar{\tilde{r}}_i= \tilde{n}_i^{-1}\sum_{j\in s_i} \delta_{ij}\{\log(y_{ij})-\beta_0-\boldsymbol{z}_{1,ij}'\boldsymbol\beta_1\}$$
Remark: when \(\rho=0\), \(\gamma_i = {\sigma_u^2}/({\sigma_u^2+\sigma_e^2/\tilde{n}_i})\), \(u_i|\boldsymbol{y}^*_{s_i}\sim N(\gamma_i\bar{\tilde{r}}_i, \gamma_i{\sigma_e^2}/{\tilde{n}_i})\).
Conditional Distribution (Cont'd)
Result 2:
$$f(b_i|\boldsymbol{y}_{s_i}^*) \propto \pi_{s_i}(b_i)\phi(\frac{b_i-m_i}{\sqrt{v_i}})$$ where \(\phi(\cdot)\) is the probability density function of standard normal distribution, $$\pi_{s_i}(b_i)=\prod_{j \in s_i}\Big [ p_{ij}\delta_{ij}+(1-p_{ij})(1-\delta_{ij})\Big ]$$ and \(p_{ij}(b_i)=g^{-1}(\alpha_0+\boldsymbol\alpha_1\mathbf z_{ij}+b_i)\). $$\color{blue}{(m_i, v_{i}) =(\frac{\rho\sigma_u\sigma_b}{\sigma_u^2+\sigma_e^2/\tilde{n}_i}\bar{\tilde{r}}_i, \frac{1-\rho^2}{1-(1-\gamma_i)\rho^2}\sigma_b^2)}.$$ Remark: when \(\rho=0\), \((m_i, v_{i})=(0, \sigma_b^2)\).
Conditional Distribution (Cont'd)
Result 3:
$$E(y_{ij}^*|\boldsymbol{y}_{s_i}^*, \boldsymbol\theta) = h_{ij}(\boldsymbol\theta)E(p_{ij}(b_i)\color{blue}{\eta(b_i)}|\boldsymbol{y}_{s_i}^*)$$ where \(h_{ij}(\boldsymbol\theta) = \exp(\beta_0+x_{ij}'\beta_1+{\gamma_i}\bar{\tilde{r}}_i + \tilde{\sigma}_{u_i}^2/2+\sigma_e^2/2)\) and \(\eta(b_i)=\exp((1-\gamma_i){\rho}\sigma_u/\sigma_b b_i).\)
👉 \(\hat{y}_{ij}^{*\rm{EB}} = E(y_{ij}^*|\boldsymbol{y}_{s_i}^*, \hat{\boldsymbol\theta})\)
Remark: The proposed predictor can accommodate any parametrized link (transformation) function for the positive part and the binary part.
Parameter Estimation
Given \(\rho \neq 0\), how to get a consistent estimator for model parameter \(\boldsymbol\theta = (\boldsymbol\beta', \boldsymbol\alpha', \sigma^2_u, \sigma^2_b, \sigma^2_e, \rho)'\)? 😣
Parameter Estimation
Given \(\rho \neq 0\), how to get a consistent estimator for model parameter \(\boldsymbol\theta = (\boldsymbol\beta', \boldsymbol\alpha', \sigma^2_u, \sigma^2_b, \sigma^2_e, \rho)'\)? 😣
Full likelihood function: $$\begin{eqnarray}L_i(\boldsymbol\theta) &=& \frac{(1-\gamma_i)^{1/2}(v_i/\sigma_b^2)^{1/2}}{(2\pi\sigma_e^2)^{\tilde{n}_i/2}}\exp(\frac{\gamma_i\bar{\tilde{r}}_i^2}{2\sigma_e^2/\tilde{n}_i} + \frac{m_i^2}{2v_i}-\frac{\sum_j\tilde{r}_{ij}^2}{2\sigma_e^2}) \\ && \int \pi_{s_i}(b_i)\frac{1}{\sqrt{v_i}}\phi(\frac{b_i-m_i}{\sqrt{v_i}})\mathrm{d}b_i\end{eqnarray}$$ Remark:
A good starting value and the gradient vector \(\partial L/\partial\boldsymbol\theta\) help
optimfind the optimizer much faster. ✌️Profiling out \(\rho\) takes much longer time to find the MLE.
first approach also allows inference for simultaneous confidence interval or hypothesis test
MSE Estimator
Formally, the MSE of an EB predictor is $$\rm{MSE}(\hat\zeta_{i}^{EB}) = M_{1i}(\boldsymbol\theta) + M_{2i}(\boldsymbol\theta)$$ where $$M_{1i}(\boldsymbol\theta)=E(\hat\zeta_{i}^{\rm{MMSE}}-\zeta_{i})^2 = O(1), \text{ as } D \to \infty$$ and $$M_{2i}(\boldsymbol\theta)=E(\hat\zeta_{i}^{\rm{EB}}-\hat\zeta_{i}^{\rm{MMSE}})^2 = o(1), \text{ as } D \to \infty$$ Recall that $$\hat\zeta_{i}^{\rm{MMSE}} = E[\zeta_{i}|\boldsymbol{y}_{s_i}^*, \boldsymbol{\theta}], \hat\zeta_{i}^{\rm{EB}} = E[\zeta_{i}|\boldsymbol{y}_{s_i}^*, \hat{\boldsymbol{\theta}}]$$
\(M_{2i}(\boldsymbol\theta)\) results from the parameter estimation process.
MSE Estimator (Cont'd)
So the MSE of the optimal predictor is $$M_{1i}(\boldsymbol\theta)=E(E[\zeta_{i}|\boldsymbol{y}_{s_i}^*, \boldsymbol\theta] - \zeta_{i})^2=E[V(\zeta_{i}|\boldsymbol{y}_{s_i}^*, \boldsymbol\theta)]$$ We propose a One-Step MSE estimator defined by $$V(\zeta_{i}|\boldsymbol{y}_{s_i}^*, \color{red}{\hat{\boldsymbol\theta}}) = \frac{1}{N_i^2}\sum_{j \in \bar{s}_i}\sum_{k \in \bar{s}_i}\Big[E\{y^*_{ij}y^*_{ik}|\boldsymbol{y}_{s_i}^*, \hat{\boldsymbol\theta}\} - E\{y^*_{ij}|\boldsymbol{y}_{s_i}^*, \hat{\boldsymbol\theta}\}E\{y^*_{ik}|\boldsymbol{y}_{s_i}^*, \hat{\boldsymbol\theta}\}\Big]$$ where $$E\{y^*_{ij}y^*_{ik}|\boldsymbol{y}_{s_i}^*\} = h_{ij}h_{ik}\exp(\tilde{\sigma}_{u_i}^2)E[p_{ij}p_{ik}\color{blue}{\eta(2b_i)}|\boldsymbol{y}_{s_i}^*],j \neq k$$ and $$E\{y^*_{ij}y^*_{ik}|\boldsymbol{y}_{s_i}^*\} = h_{ij}^2\exp(\tilde{\sigma}_{u_i}^2+\sigma_e^2)E[{p_{ij}}\color{blue}{\eta(2b_i)}|\boldsymbol{y}_{s_i}^*],j = k$$
Alternate MSE Estimators
Denote original parameter estimate \(\hat{\boldsymbol{\theta}}\), bootstrap population \(\boldsymbol Y^{*(b)}\), bootstrap sample \(\boldsymbol y^{*(b)}\), parameter estimate \(\hat{\boldsymbol{\theta}}^{(b)}\)
For \(b = 1,\ldots, B\), we obtain $$\boldsymbol Y^{*(b)} \longrightarrow \bar{y}_{N_{i}}^{*(b)}$$ $$\boldsymbol{y}^{*(b)}, \hat{\boldsymbol{\theta}} \longrightarrow \hat{\bar{y}}_{N_i}^{*(b)\rm{MMSE}}$$ $$\boldsymbol{y}^{*(b)}, \hat{\boldsymbol{\theta}}^{(b)} \longrightarrow \hat{\bar{y}}_{N_i}^{*(b)\rm{EB}}$$
\(\hat{\mbox{MSE}}_{i}^{\color{blue}{\mbox{Boot}}} = B^{-1}\sum_{b = 1}^{B}(\hat{\bar{y}}_{N_{i}}^{*(b)\mbox{EB}} - \bar{y}_{N_{i}}^{*(b)})^{2}\)
\(\hat{\mbox{MSE}}_{i}^{\color{blue}{\mbox{Semi-Boot}}} = \hat{M}_{1i} + \hat{M}_{2i}^{\mbox{Boot}}\) where a bootstrap estimator of \(M_{2i}\) is defined by \(\hat{M}_{2i}^{\mbox{Boot}} = B^{-1}\sum_{b = 1}^{B}( \hat{\bar{y}}_{N_{i}}^{*(b)\mbox{EB}} - \hat{\bar{y}}_{N_{i}}^{*(b)\mbox{MMSE}})^{2}\)
Simulation Setting
Number of areas: \(D = 60\)
Sample rate: \((N_i, n_i) = (71, 5), (143, 10), (286, 20)\) for every 20 areas so that \((N, n)=(10000, 700)\)
logitlink for the binary partOne-dimensional covariates: \(z_{ij}\sim N(4.45, 0.055)\)
\(\boldsymbol\beta = (-13, 2)', \boldsymbol\alpha = (-20, 5)'\), \((\sigma_u^2, \sigma_e^2, \sigma_b^2) = (0.22, 1.23, 0.52)\)
\(\rho \in \{-0.9, -0.6, -0.3, 0, 0.3, 0.6, 0.9\}\)
Compare the proposed EB predictor with the EB(0) predictor \(\hat \zeta_{i}^{\rm{EB}}\mid_{\rho=0}\)
Remark: the EB(0) predictor (Lyu 2018) is based on \(\hat{\boldsymbol\theta}_0\) obtained from fitting the two parts separately
Simulation Results
$$\rm{RDMSE}_i = \frac{\rm{MSE}(\hat\zeta_i^{\rm{EB(0)}}) - \rm{MSE}(\hat\zeta_i^{\rm{EB}})}{\rm{MSE}(\hat\zeta_i^{\rm{EB}})}$$

compared with the EB predictor based on 1000 simulations.
Simulation Results
$$\rm{RBMSE}_i = \frac{\hat{\rm{MSE}}_{i} - \rm{MSE}(\hat\zeta_i)}{\rm{MSE}(\hat\zeta_i)}, \rm{CI}_i = \hat\zeta_i\pm1.96\sqrt{\hat{\rm{MSE}}_{i}}$$

Estimating the leading term directly seems to improve the quality of CIs based on "Boot" when B = 100
Application to CEAP data
Data Description
Response
RUSLE2: sheet and rill erosion from cropland tons/yr
Auxilliary information
On a cropland grid at a spatial resolution of 56m
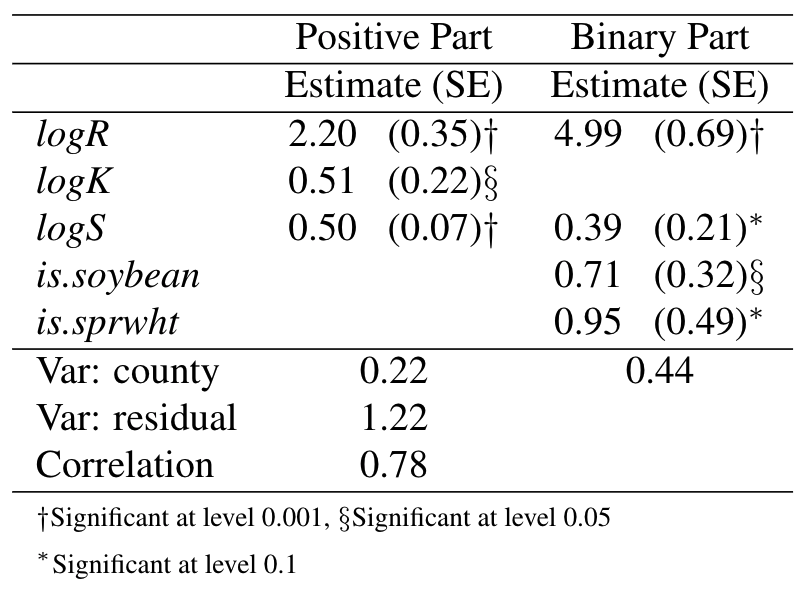
logR 💦: log-scale county-level Rainfall factor 👈 NRI
logK 🗻: log-scale erosion factor 👈 Soil Survey
logS 📐: log-scale slope gradient factor 👈 Soil Survey
crop_type 🌱: corn, soybean, sprwht or wtrwht 👈 CDL
Application to CEAP data
Data Description
Parameter Estimates
Based on the observed information matrix, 95% confidence interval for \(\rho\) is \((0.67, 0.84)\).
Application to CEAP data
Data Description
Parameter Estimates
EB Predictions
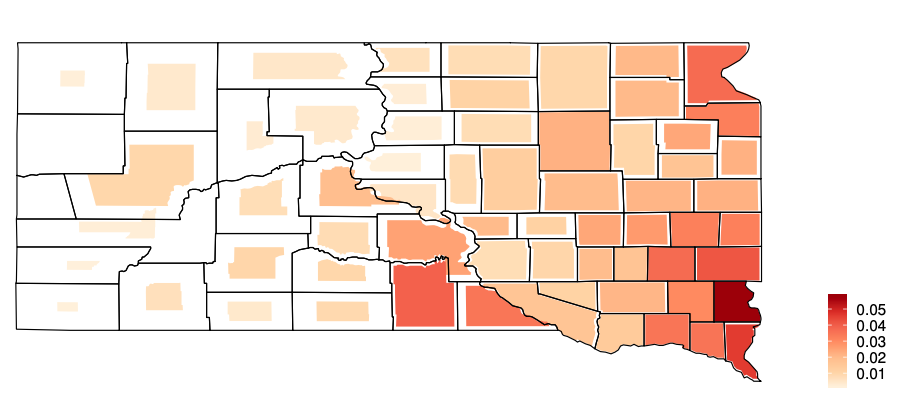 Figure 1. Cartogram of the EB predicted county means of cropland RUSLE2 in South Dakota. Smaller shrinkage indicates smaller coefficient of variance.
Eastern South Dakota: more cropland, more samples, more positive response Two counties have no sample, many counties have less than 5 samples, some county at most 30 samples. mean SE around 0.005
Conclusion
A frequentist approach has been proposed to fit zero-inflated lognormal model with correlated random effects in small area prediction.
When the true correlation deviates far from 0, the EB(0) predictor (Lyu 2018) has moderately larger MSE than the EB predictor (without model mis-specification).
The data analysis of the cropland CEAP RUSLE2 measurements collected in South Dakota shows the model assumptions are reasonable.
Appendix A: CEAP RUSLE2 Residual Analysis
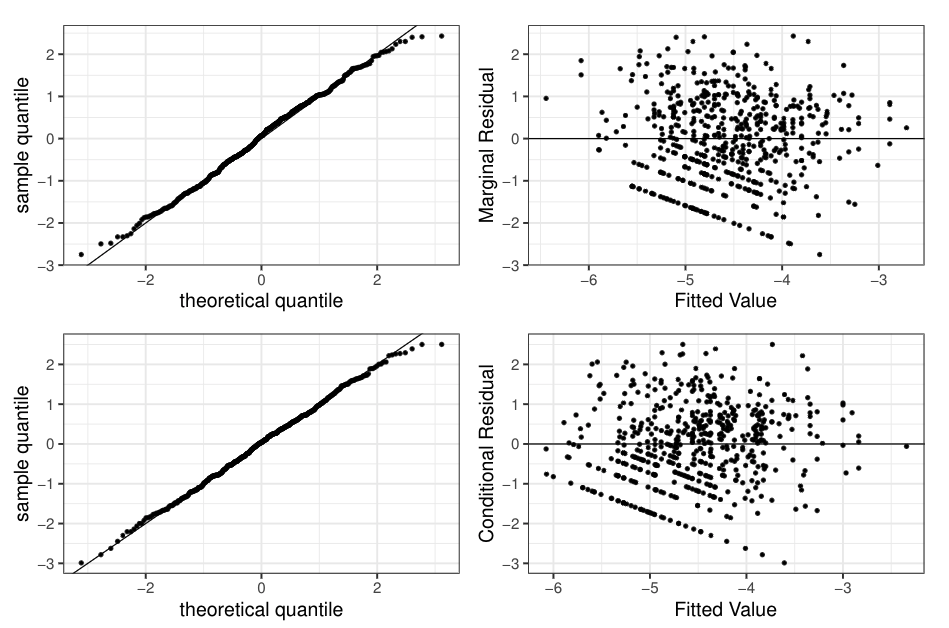
Positive part fitted value: marginal 👉 \(\boldsymbol{x}_{ij}'\hat{\boldsymbol{\beta}}\), conditional 👉 \(\boldsymbol{x}_{ij}'\hat{\boldsymbol{\beta}} + \hat{E}[u_{i} | \boldsymbol{y}_{s_i}^*]\)
- marginal residual (top): \((\mbox{log}(y_{ij}) - \boldsymbol{x}_{ij}'\hat{\boldsymbol{\beta}})/\sqrt{\hat{\sigma}^{2}_{u}+ \hat{\sigma}^{2}_{e}}\)
- conditional residual (bottom): \((\mbox{log}(y_{ij}) - \boldsymbol{x}_{ij}'\hat{\boldsymbol{\beta}} - \hat{E}[u_{i} | \boldsymbol{y}_{s_i}^*])/\sqrt{\hat{\sigma}^{2}_{e}}\)
Appendix A: CEAP RUSLE2 Residual Analysis
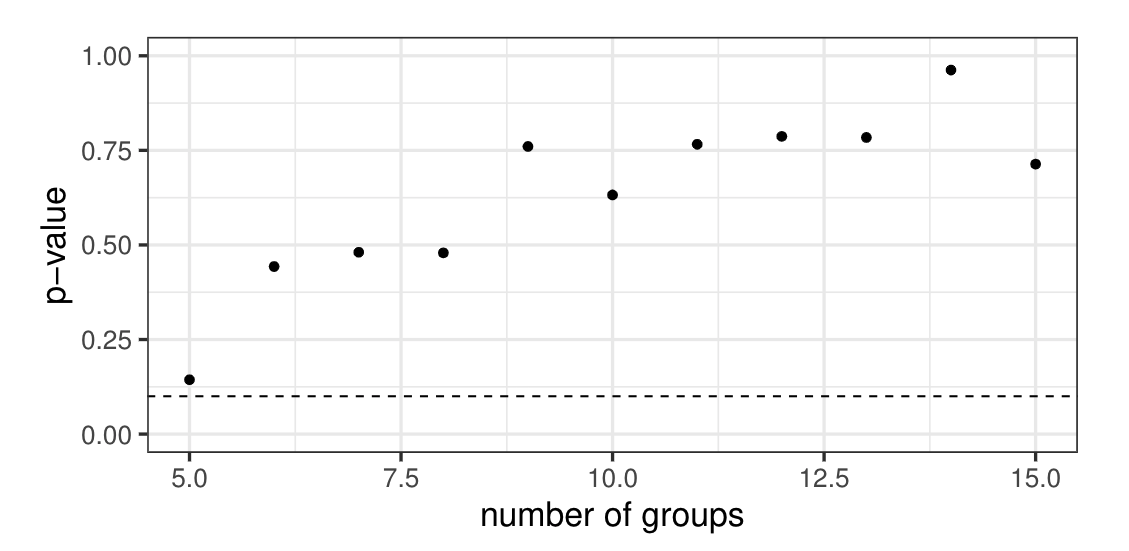
Binary part: Hosmer-Lemeshow test with \(\hat{p}_{ij} = E[p_{ij}(b_i) | \boldsymbol{y}_{s_i}^*]\)
Appendix B: Simulation results
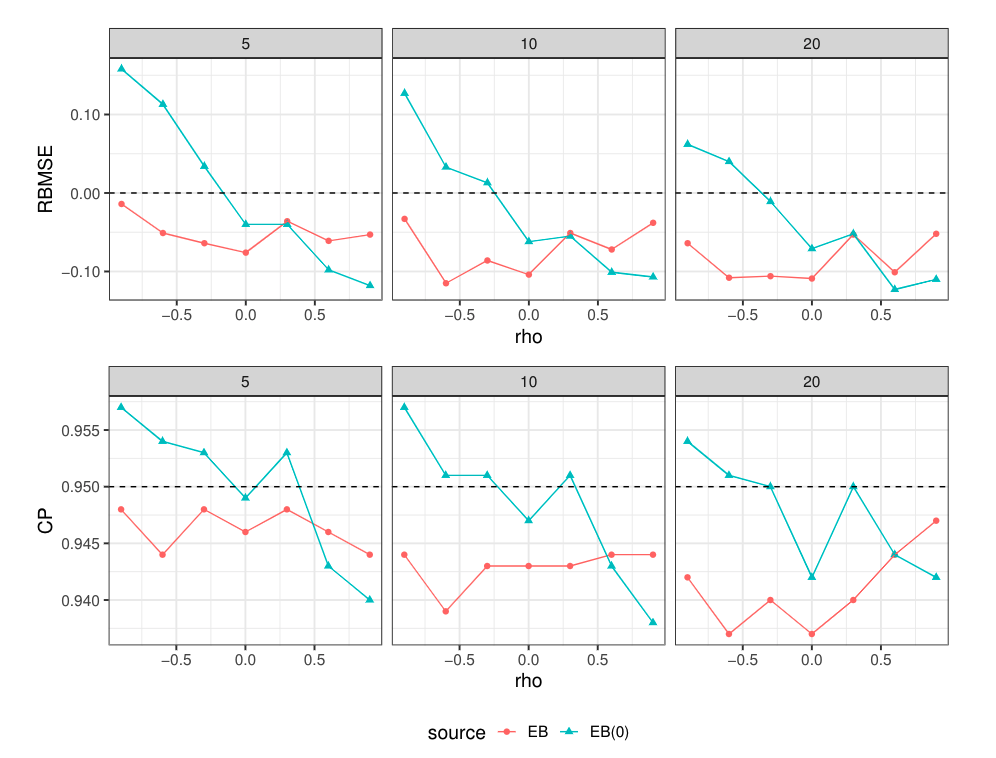
for the EB and the EB(0) predictor based on 1000 simulations.